


What Is Attribution (Conversion Attribution)?
Attribution is how you divide the "credit" for an order among the channels and campaigns that a customer touched before making a purchase: a Facebook post, an email, a Google search, a webinar. Each way of dividing credit is called an attribution model, for example giving all credit to the first touch, the last touch, or splitting equally. Attribution helps small businesses answer a practical question: which channels should I keep funding, and which should I cut. One honest thing I need to say upfront: no model reveals the "truth" about which channel brought in an order, only one way of looking at it with assumptions built in; numbers between advertising platforms and Google Analytics 4 almost never match; and this post doesn't promise that attribution will increase revenue. OPCAIOS has an internal revenue attribution tool but hasn't published any numbers from it yet. This post covers the models, why numbers differ, how to do enough for a small business using UTM, the question "where did you hear about us" and CRM, along with unavoidable limitations.
One order, many touchpoints, many ways to divide credit. Diagram: OPCAIOS.
What question does attribution solve?
Attribution solves the question "which marketing dollars are working," by connecting an order to the touchpoints that came before it. A typical small business customer might see a post on Facebook, open a newsletter email two weeks later, then type the brand name into Google and buy. If you only look at the Google report, the credit goes to search; if you only look at Facebook Ads, the credit goes to advertising; in reality all three played a part. Attribution can't measure "would this customer have bought without this channel"; that question needs an experiment with a control group (turn off the channel for one group, keep it for another). Attribution just rearranges the touchpoint data that's already been recorded.
How do the different attribution models differ?
The attribution models differ in the rules for dividing credit among touchpoints. Five common models:
- First-touch: 100% credit to the first touchpoint. Good for seeing which channel brings new awareness of you.
- Last-touch: 100% credit to the touchpoint right before purchase. Good for seeing which channel "closes" the sale, but tends to over-reward branded search and email.
- Linear: credit split equally among all touchpoints.
- U-shaped (position-based): typically 40% to the first touchpoint, 40% to the last, 20% split among the middle ones.
- Time decay: the closer a touchpoint is to purchase, the more credit it gets.
| Model | Answers this question well | Weakness |
|---|---|---|
| First-touch | Which channel brings new customers? | Ignores everything after that |
| Last-touch | Which channel is at the checkout? | Ignores the awareness-building part |
| Linear | How much does each channel contribute? | Treats every touchpoint the same |
| U-shaped | Opening and closing? | The 40/20/40 ratio is just convention, not measured |
| Time decay | Which channel is closest to purchase? | Unfair to channels that build awareness |
Which attribution model does GA4 use?
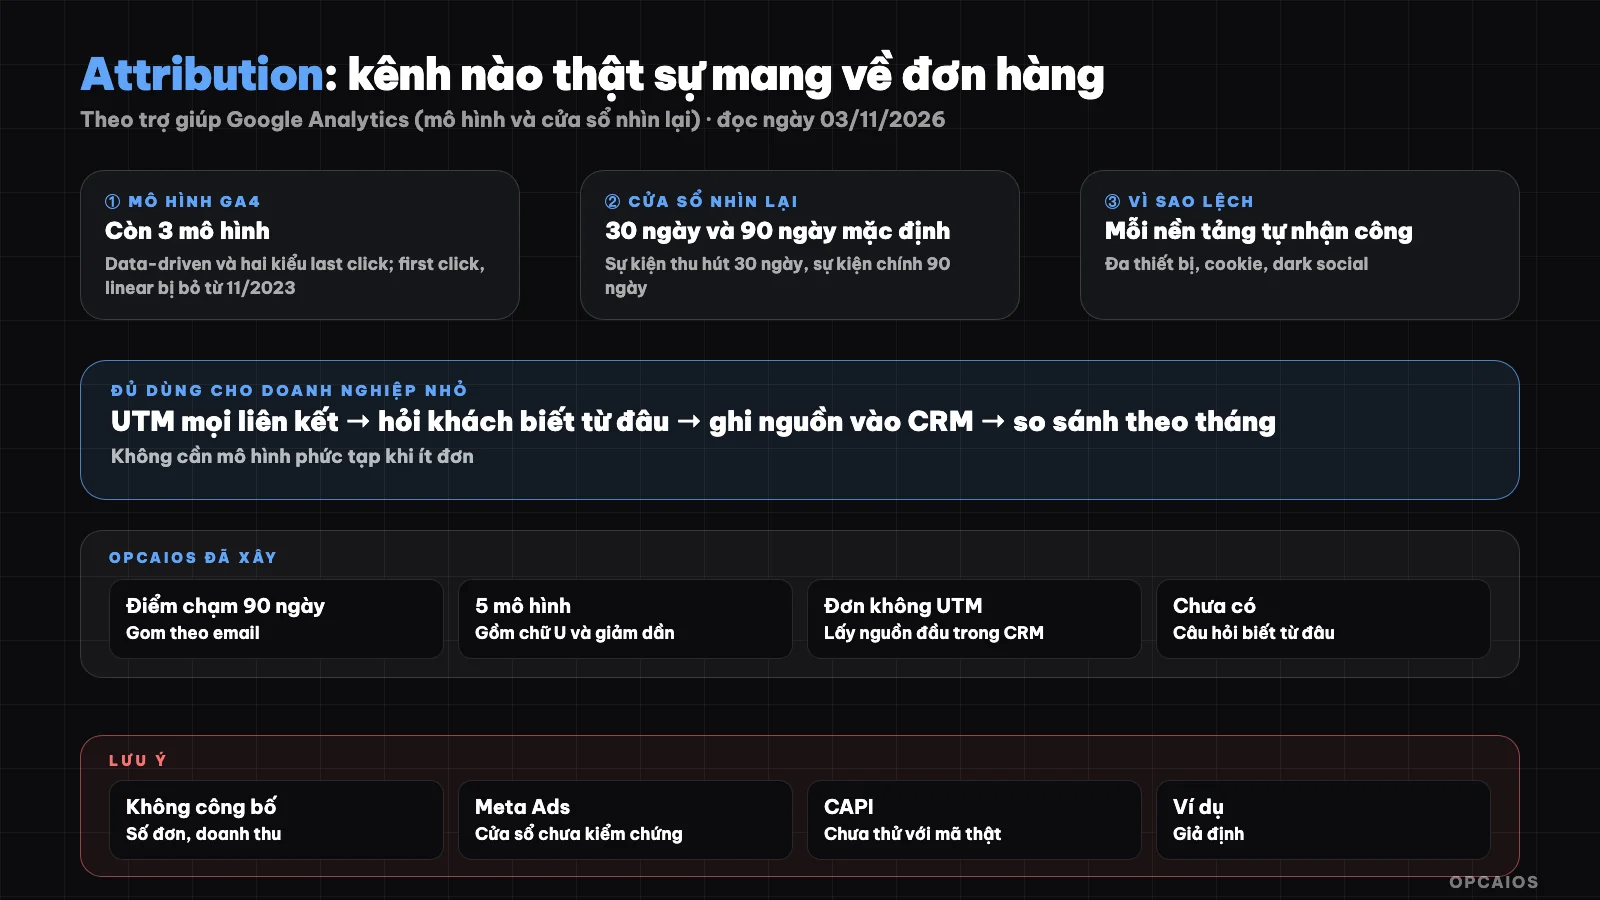
Google Analytics 4 now only has three models: data-driven attribution, paid and organic last click (last click excluding direct traffic), and Google paid channels last click. According to the Google Analytics help page on attribution models (read on 03/11/2026), the first click, linear, time decay, and position-based models stopped being available from November 2023. Data-driven attribution uses machine learning on both journeys with conversions and journeys without conversions, comparing what actually happened to what might have happened if a touchpoint was missing, then dividing credit based on how much that touchpoint raised the probability of conversion; Google also re-attributes conversions within up to 7 days after they occur. The default lookback window is 30 days for acquisition events (first_visit, first_open, can be changed to 7 days) and 90 days for other key events (can choose 30 or 60 days). For small businesses with few conversions, the data-driven model has little data to learn from, so the results need careful reading. See how to set it up in the post What is GA4.
Why do numbers between advertising platforms and GA4 not match?
Numbers between advertising platforms and GA4 don't match because each side counts by its own rules, on its own data, and each tends to take credit for itself. Five common reasons:
- Different model: GA4 by default distributes credit across all channels, while the advertising platform only sees its own ads.
- Different time window: each platform has its own conversion window after a click or view; one order can be claimed by both sides.
- View-throughs without clicks: the advertising platform can count an order for someone who only viewed the ad, GA4 doesn't see that view.
- Lost browser tracking: cookie blocking, ad blockers, in-app browsers cause GA4 to miss sessions.
- Different time zones and recording times: the platform records by click date, GA4 records by conversion date, so daily reports differ.
We haven't verified in this reading the current default attribution window for Meta Ads, so we don't state a number. Practical approach: pick one source of truth for revenue (orders paid in your sales system), use the advertising platform to optimize within the platform, and only compare trends, not add numbers between tools. Sending events from your server helps the platform lose less data; see What is Meta Conversions API (CAPI).
How much attribution should a small business do?
A small business should do attribution at the level of "enough to decide next month's budget," not a complex multi-touch system. Three layers of data that are cheap and complement each other:
- UTM on every link you control: posts, emails, ads, bio, QR codes. Set unified names, lowercase, for example utm_source=facebook, utm_campaign=webinar-month-11. See naming rules in What is UTM.
- Self-reported question "How did you find us?": one field in your sign-up form or checkout page, with preset options plus an "other" field. This question catches what UTM doesn't see: referrals from friends, Zalo groups, podcasts, a video watched from last month.
- Record source in your CRM: save first touch of each contact and UTM at purchase of each order, linked to email or phone. Then you can look back at both first touch and last touch for each customer. See What is CRM.
A hypothetical example, not real numbers: an online course sells 40 orders in a month; by UTM at checkout, 25 orders come from email; by self-reported question, 18 people say they found out through YouTube video. The two numbers don't contradict: YouTube starts it, email closes it. Reading both sources together is more useful than trusting one.
What limits does attribution have that can't be avoided?
Attribution has unavoidable limits because there is always part of the journey that leaves no digital trace. Four main limits:
- Dark social: links shared through Zalo, Messenger, personal email, text messages often lose source and show as "direct" or "unknown." Word-of-mouth referrals have no link at all.
- Multi-device: customer views on phone, buys on computer; if they don't log in or leave email on both, the system sees two different people.
- Cookies and privacy: browsers restrict cookies, users refuse tracking, cookies expire; the journey gets cut short.
- Small data: a few dozen orders a month means one big customer can skew the whole table.
So make decisions based on trends over several months, combined with self-reported numbers, and when you have the budget, try turning off one channel under controlled conditions to see how revenue changes. Related to concepts of funnel and customer cohorts in Funnel and cohort for small business.
OPCAIOS's Experience
OPCAIOS has a "Revenue Attribution" page in the internal marketing management section, written automatically by a programming agent. For each order paid within 90 days, the system collects all touchpoints with the same campaign code of the buyer's email: form submission, landing page or webinar signup with UTM; first source recorded in the CRM; clicks on links in the nurture email sequence; and the UTM from the browser tab when payment was made (saved immediately upon order placement). Touchpoints are ordered chronologically, consecutive identical campaigns count only once, then revenue is divided across five attribution models placed side by side: first touch, last touch, linear, U-shaped 40/20/40, and time decay with a 7-day half-life. A separate page shows efficiency and ROI by linking orders to costs (entered manually or pulled from Facebook Ads); orders without UTM at purchase use the first source from the CRM. Limitations we know: we can only link by email, so customers who change email or arrive through dark social leave no touchpoint; we haven't yet added a "how did you hear about us" question to the form; and we haven't disclosed any order numbers, revenue, or attribution results. Meta CAPI integration is written but hasn't been tested with real access credentials.
Frequently Asked Questions
Which attribution model should small businesses choose?
Start by placing first touch and last touch side by side, because these two models are easy to understand and answer two different questions: which channel brings new people, which channel closes the sale. If a channel is strong in first touch but weak in last touch, it's usually an awareness-building channel—don't cut it just because the last-touch report looks low. Linear or U-shaped models should only be added when customers typically have three or more touchpoints.
Why does Facebook Ads report more orders than GA4?
Because each side counts by its own rules. The ad platform only sees its own ads, may count even people who just view without clicking, and uses its own time window; GA4 shares credit across all channels and loses data when cookies are blocked. One order can be credited to both sides. Don't add or subtract numbers between the two tools. Use paid orders from your sales system as the source of truth, use the platform's numbers to optimize within that platform, and compare trends by week or month.
Is the "how did you hear about us" question trustworthy?
Trustworthy as a reference point, and it supplements UTM well. Respondents can misremember, pick the first option, or only remember the most recent touchpoint. In exchange, this question captures word-of-mouth, chat groups, podcasts—things that don't leave a link. Use a short list of options, shuffle the order if your form tool allows, add an "other" field for custom responses, and read results as trends over many months rather than individual answers.
Do you need a paid attribution tool?
For small businesses, usually not yet. UTM, free GA4, a self-reported field in the form, and a CRM or spreadsheet tracking the source for each customer is enough to see which channels are worth keeping. Paid tools help when you advertise across many platforms, have many orders daily, and need to automatically connect data between systems.
Can attribution replace channel shutoff testing?
No. Attribution only divides credit among touchpoints that were recorded; it can't answer whether a customer would buy if that channel were missing. Testing needs a control group—for example, temporarily pause ads in a region or to a customer segment for a few weeks—to measure the real lift. Small businesses can do a simpler version: turn off one channel with control and track total revenue. To learn how to set up UTM, CRM, and marketing reports with AI, see OPCAIOS's AI application training course.
Sources: Google Analytics Help, pages on attribution models and event conversion windows (read 03/11/2026); Meta Ads default lookback window not yet verified; the 40-order example is assumed; OPCAIOS has not disclosed any attribution figures. The experience is OPCAIOS's.
Translated from Vietnamese with AI. Read the original.
Want to apply this in your business?
Book a free 30-minute call (Vietnam time, in English or Vietnamese).