



A/B test landing page khi lưu lượng thấp
A/B test landing page là cách chia ngẫu nhiên người xem thành hai nhóm, một nhóm thấy bản gốc, một nhóm thấy bản sửa, rồi so tỉ lệ chuyển đổi để biết bản nào tốt hơn. Với website nhỏ chỉ vài chục lượt xem mỗi ngày, A/B test landing page rất dễ cho kết luận sai: vài khách ngẫu nhiên đủ làm một bản "thắng" tuần đầu rồi thua tuần sau. Bài này không hứa mẹo test nhanh với ít lượt xem; bài giải thích vì sao ít lượt xem gây nhiễu, cách ước lượng cỡ mẫu bằng công thức có nguồn, chọn một chỉ số chính, chạy đủ chu kỳ tuần, khi nào nên bỏ test, và cách ghi nhật ký thử nghiệm. Phần kinh nghiệm mô tả công cụ OPCAIOS tự xây; chúng tôi chưa có kết quả thử nghiệm thật để công bố.
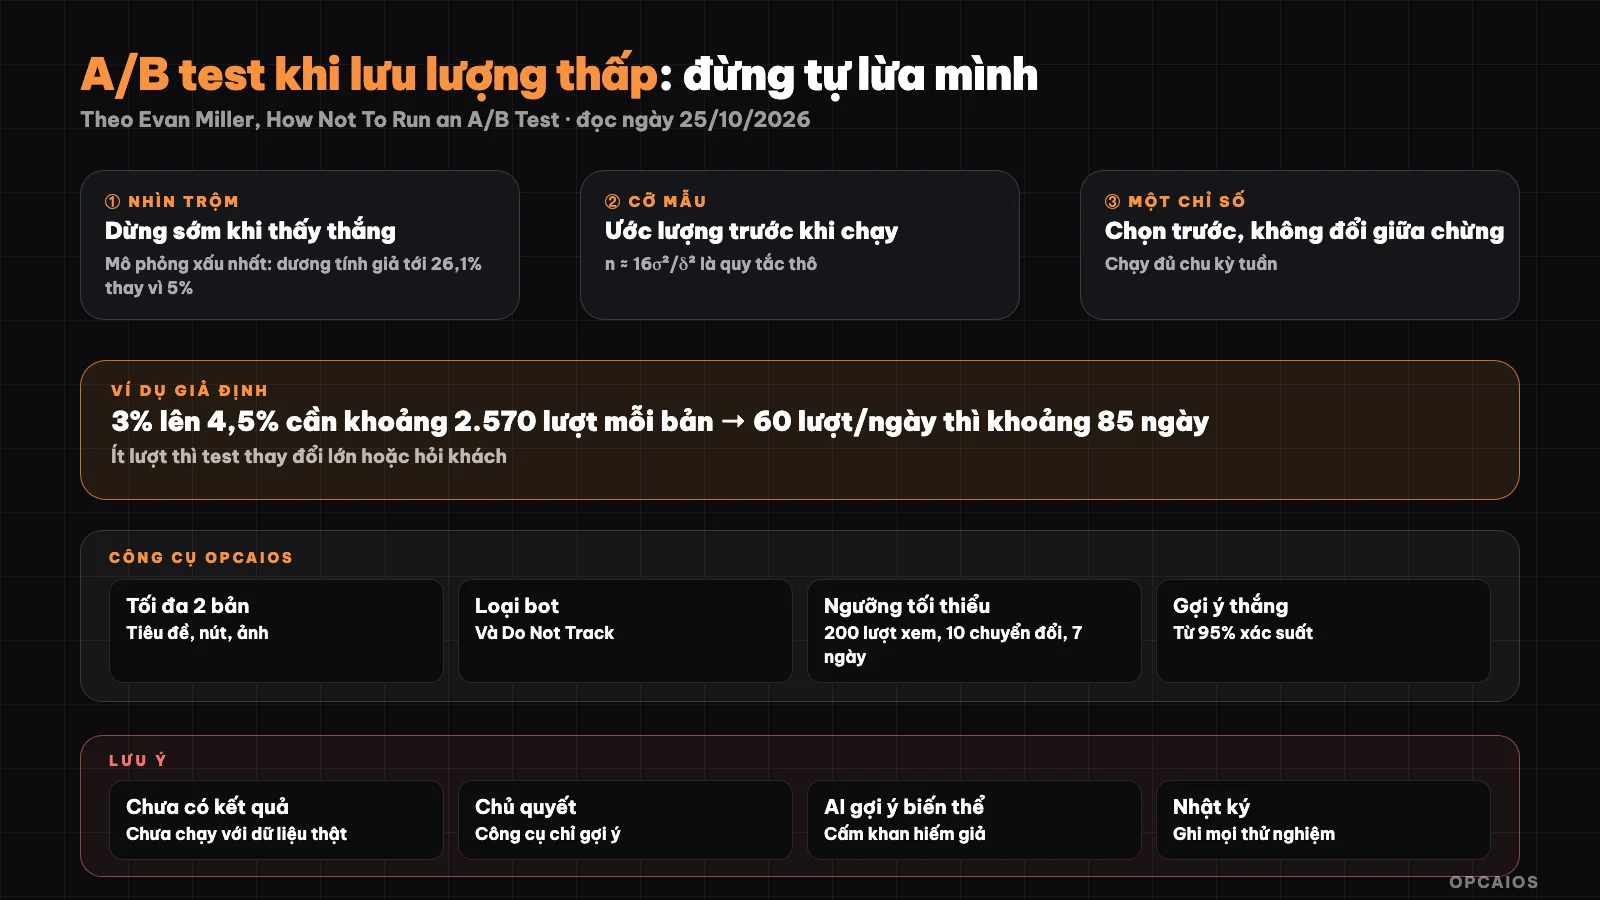
Ít lượt xem thì quyết định cỡ mẫu và thời gian trước khi chạy, hoặc chọn cách học khác. Sơ đồ: OPCAIOS.
Why is A/B testing with low traffic easy to get wrong?
A/B testing with low traffic is easy to get wrong because random fluctuation is much larger than the real difference between two page versions. Say version A has 3 conversions out of 100 views and version B has 6 conversions out of 100 views: the number "doubled" looks convincing, but the difference is just 3 people, and it only takes a few customers from a shared post one afternoon to create that difference. There are three main traps:
- Random fluctuation: with a small sample, the conversion rate of the same page jumps up and down hard between weeks.
- Stopping early: stopping as soon as you see one version leading is picking the right moment when noise favors that version.
- Peeking at results: checking results every day and stopping when "already statistically significant" makes the false positive rate shoot past the 5% you set.
Evan Miller, in his post "How Not To Run an A/B Test" (read on 25/10/2026), simulates two identical page versions and shows that checking after each view and stopping when you hit 5% leads to a 26.1% wrong conclusion rate, more than five times the nominal level; the author makes clear that is the worst case.
How many views do you need for an A/B test landing page?
The sample size you need for an A/B test landing page depends on your current conversion rate and the smallest difference you want to detect; the smaller the difference, the more views you need, by the square. A quick estimation rule is Lehr's rule (Robert Lehr, Statistics in Medicine journal, 1992): n = 16 × p × (1 − p) / d², where n is the number of views for EACH version, p is the expected average conversion rate, d is the absolute difference you want to detect. The rule goes with 5% two-sided significance and 80% power, and is just a rough estimate, not a replacement for a full calculation. Evan Miller also gives the formula 16σ²/δ² as a rule of thumb, with σ² = p(1 − p) for conversion rate.
Example assumption, not real numbers: your page has a 3% signup rate, you want to detect a jump to 4.5%. Then average p is around 0.0375, d = 0.015, n ≈ 16 × 0.0361 / 0.000225 ≈ 2,570 views per version, or about 5,100 views for both. With 60 views a day, the test takes around 85 days. To detect a difference half as big, you need about four times the views.
| You have | Result |
|---|---|
| A few hundred views a month | Can only detect very large changes, usually should not test |
| A few thousand views a month | Can test large changes, run for many weeks |
| Small expected difference (a few percent relative) | Needs traffic that small websites rarely have |
For more accurate numbers, use Evan Miller's Sample Size Calculator and plug in your page's real rate.
Which metrics should I measure when testing a page?
A landing page A/B test should have exactly one primary metric, chosen before you start, tied directly to the page's purpose. Measuring many metrics at once and then picking whichever one "wins" is another form of self-deception: the more metrics you measure, the more likely one will look different just by chance.
- Primary metric: the action the page exists to create, for example submitting a form, clicking to buy, or booking a consultation.
- Guard metrics: one or two metrics just to check that the new version doesn't break something else, for example refund rate or number of complaints.
- Don't use as primary metric: time on page, scroll depth, generic clicks, because they don't reliably lead to customers.
Define your conversion clearly before you run the test, for example whether it counts in the same session or within a few days after viewing.
Why must I run an A/B test for full weekly cycles?
A/B tests need to run through complete weeks because people who visit on weekdays and weekends usually differ in traffic source, device, and purchase intent. Running Monday through Thursday and then stopping means the results ignore the weekend customer group. The practical rule is to decide in advance on sample size and number of weeks (minimum one full week, usually a few weeks for small websites), then only read results when both conditions are met. While it runs, avoid changing other things on the page, avoid running a viral ad for just one version, and record any unusual events like a post going viral or a sudden promotion.
When should I not A/B test a landing page?
I should not A/B test a landing page when traffic is too low to reach sample size within a few months, or when the problem is clear enough that you don't need statistics to see it. In those cases, these approaches usually teach faster:
- Interview customers: ask five to ten people who just bought or just left what they were unsure about; also see how to use AI to analyze customer psychology on landing pages to prepare your questions.
- Fix obvious errors: button doesn't work on mobile, form too long, page loads slowly, price hard to understand; fix it right away, no need to test.
- Test big changes: change your core promise, audience, or page structure instead of changing button color; big changes have a chance to create a difference large enough to see with fewer views.
How do I keep an experiment journal?
An experiment journal is a short record for each test, written before you run it and updated when you finish, so that months later you know what you tried and what you learned instead of repeating the same idea. Each entry should have:
| Field | Example content |
|---|---|
| Hypothesis | "Stating the result directly in the headline will increase the number of people submitting the form" |
| Changes and primary metric | Only changed the headline; measure number of form submissions |
| Sample size, number of weeks, start and stop dates | Write before running, with reason for stopping |
| Results, decision, lesson | Views and conversions for each version, even in a tie |
A result of "no difference" is also a lesson: that change wasn't big enough to matter to your customers.
OPCAIOS's Experience
OPCAIOS has a "Test Page" tool in the marketing administration area, built by the website owner together with a programmer agent. Conceptually:
- Only change the displayed part of the page from data: title, lead paragraph, button text, illustrative images; maximum two variants tested alongside the original.
- Random but fixed allocation: each visitor receives a random code in the browser so returning still shows the same variant; bots, automated browsers, and people with "Do Not Track" enabled only see the original and are not counted.
- One goal per experiment: form submission on the page, purchase click, or booking a consultation (see automatic scheduling for one-person services).
- Block early results reading: only considered "sufficient data" when each variant reaches minimum views and conversions (default 200 and 10, adjustable) and has run for at least 7 days.
- Human chooses the winner: the tool calculates the probability that the variant is better than the original using Bayesian methods, only suggests when 95% or higher; the website owner's click always locks the winner.
- AI suggests variants: each variant tests one hypothesis, no new promises added, no fabricated numbers, no artificial scarcity created; has a note field as a journal.
Plainly: the 200 views threshold is only a floor to prevent reading too early, not enough to detect small differences, and the continuously displayed probability is still easy to peek at. According to the project notes, the tool has not been validated with real data; we have no test results to share yet. See also letting AI agents build and operate websites and automatic sales funnel.
Frequently Asked Questions
How many views are enough to A/B test a landing page?
There is no universal number, because sample size depends on the current conversion rate and the magnitude of difference you want to detect. By Lehr's rule (n = 16 × p × (1 − p) / d² per variant, 5% significance level, 80% power), a page with a 3% rate wanting to detect an increase to 4.5% needs roughly 2,570 views per variant; this is a hypothetical example. Plug your real numbers into Evan Miller's sample size calculator before you start, and if the result requires several months then consider a different learning approach.
Can I check results daily?
Checking to catch technical errors is fine, for example if one variant is not displaying or not recording conversions. You should not use daily results to decide when to stop. Evan Miller showed that stopping as soon as you see "significance" greatly increases the rate of false conclusions compared to your set level. The safe way is to decide sample size and number of weeks in advance, only read results when both are met, or use sequential designs with predetermined check points.
Should I test small or large changes when I have few views?
Large changes. With few views, you can only detect large differences, and changing a button color or one word rarely creates that kind of difference. Try changing the main promise, target audience, page structure, or how you present pricing. Changing many things at once means you won't know exactly which factor made the difference, but with a small website, knowing which variant is better often matters more than knowing why.
If I don't have enough views to test, what should I do?
Three things usually work better: interview five to ten customers who just bought or just dropped off; fix obvious errors right away like long forms, hard-to-click buttons on mobile, slow loading pages; and revisit the promise on the page by reading common customer questions or feedback. These things need no statistics. When traffic increases, come back to A/B testing with hypotheses drawn from interviews and recorded in your experiment journal.
How do I start the first experiment?
Write a one-sentence hypothesis, pick one key metric, estimate sample size and number of weeks, then write it all in your journal before turning the experiment on. Change only one large and clear part of the page, run full weeks, do not stop early, and record the result even if no variant wins. If you want to learn how to use AI to write hypotheses, read customer feedback, and build measurement processes, see OPCAIOS's AI application training course.
Sources: Evan Miller, "How Not To Run an A/B Test" and Sample Size Calculator (evanmiller.org); Lehr's rule (Statistics in Medicine, 1992) via James Hanley's teaching materials, McGill University, accessed 25/10/2026. The sample size example is an assumption we calculated ourselves; OPCAIOS's test tool has not been validated with real data and has no results to publish. The experience is OPCAIOS's.
Translated from Vietnamese with AI. Read the original.
Want to apply this in your business?
Book a free 30-minute call (Vietnam time, in English or Vietnamese).