



What are Core Web Vitals?
Core Web Vitals is a set of three metrics that Google recommends to measure web page experience: Largest Contentful Paint (LCP) measures loading speed, Interaction to Next Paint (INP) measures responsiveness when interacting, and Cumulative Layout Shift (CLS) measures visual stability. According to web.dev (read on 25/10/2026), the "good" threshold at the 75th percentile is LCP no more than 2.5 seconds, INP no more than 200 milliseconds, and CLS no more than 0.1. This post explains what Core Web Vitals are, the thresholds, field data and lab data, how to improve, and OPCAIOS's experience.
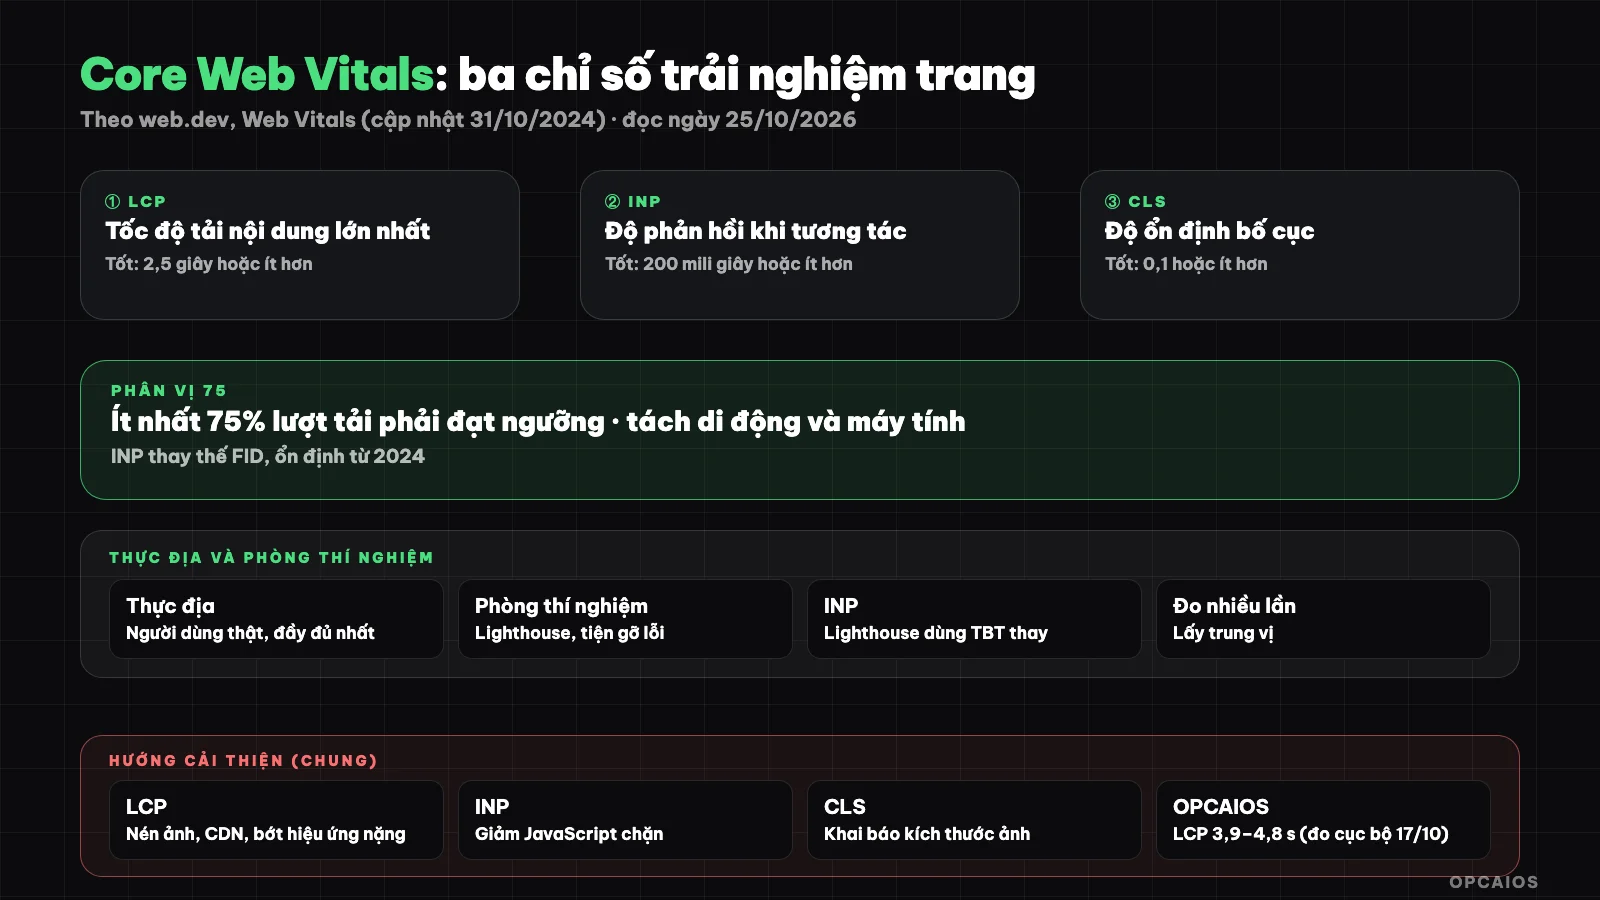
Three metrics, three thresholds, measured from real users at the 75th percentile. Diagram: OPCAIOS.
What are Core Web Vitals and what metrics do they include?
Core Web Vitals consist of three metrics focused on how real users perceive the page: how fast the page loads (LCP), whether it responds when you click or type (INP), and whether content jumps around (CLS). They are part of Google's page experience metrics.
| Metric | Measures | "Good" threshold (75th percentile) |
|---|---|---|
| LCP (Largest Contentful Paint) | Speed of loading the largest content element | 2.5 seconds or less |
| INP (Interaction to Next Paint) | Responsiveness when interacting | 200 milliseconds or less |
| CLS (Cumulative Layout Shift) | Layout stability | 0.1 or less |
According to web.dev, INP replaced First Input Delay (FID): moved from experimental to pending status in 2023 and then became a stable metric in 2024. The post was published on 4/5/2020 and last updated on 31/10/2024; web.dev says stable metrics change no more than once a year.
What does "75th percentile" mean?
The threshold is applied at the 75th percentile of page loads: at least 75% of visits must meet the threshold for the page to be considered "good" on that metric. Web.dev recommends separating results by mobile and desktop.
This is different from a single measurement: one fast load on a powerful machine does not prove the page is good for real users, especially users with low-end phones and slow networks.
Field data and lab data
Field data comes from real users; web.dev says only field measurements fully reflect the picture. Lab data, from tools like Lighthouse, is useful during development but runs in simulated conditions.
- Field data: reflects real users; needs enough traffic to get data.
- Lab data: runs repeatably, convenient for debugging; does not reflect device diversity.
- INP and Lighthouse: according to web.dev, Lighthouse cannot measure INP because there are no user interactions, so it uses Total Blocking Time (TBT) as a replacement metric.
You can see the field data for your site in the page experience report of Google Search Console when you have enough data.
How to improve each metric
Improve based on root causes: LCP is often due to slow-loading images or large text blocks; INP is due to JavaScript blocking the main thread; CLS is due to images or ads without predefined dimensions. The suggestions below are general practices of OPCAIOS, not quoted from the web.dev articles I read.
| Metric | Common causes | How to fix |
|---|---|---|
| LCP | Large images, slow server, heavy opening effects | Compress images (WebP), use CDN, prioritize main image loading, remove excess effects |
| INP | Heavy JavaScript running long | Reduce code running on the main thread, break tasks into smaller chunks |
| CLS | Images/frames without declared dimensions, font changes | Set width and height; reserve space for inserted content |
Web frameworks also matter; see Next.js là gì and Cloudflare.
OPCAIOS's experience
We measure with Lighthouse run locally and see results vary quite a bit, so we use the median of multiple runs instead of a single run. An internal note from 17/10/2026 recorded LCP around 3.9 to 4.8 seconds on the homepage due to opening effects; that is noisy local measurement, not field data, and may have changed after later optimizations.
What we learned: don't conclude from one measurement, and opening animation effects can pull LCP down significantly. Limitation: this post does not give the site's current score because we have not re-measured with field data on the writing date. See also website security audit for other technical work.
Frequently Asked Questions
Which metric does INP replace?
INP replaces First Input Delay (FID), becoming the stable Core Web Vitals metric in 2024 according to web.dev.
Do Core Web Vitals affect ranking?
The web.dev page I read doesn't discuss the impact on rankings, so I can't say for sure; consider this mainly a user experience metric.
Why does my Lighthouse score change every time?
Because lab runs are affected by noise from the machine and network. Run it multiple times and take the median.
What if my small site has no real-world data?
It may not have enough traffic for Google to report yet. Use Lighthouse to identify issues, then wait for data to come in.
Where should I start?
Measure your homepage with Lighthouse multiple times, fix the heaviest part (usually images), then monitor real-world data. Need support, see AI Application Training Service.
Source: web.dev, "Web Vitals" (published 4/5/2020, updated 31/10/2024), read on 25/10/2026; have not read individual metric documentation. Note: OPCAIOS's LCP is measured locally with noise on 17/10/2026. The improvement table is common practice at OPCAIOS. The experience is from OPCAIOS.
Translated from Vietnamese with AI. Read the original.
Want to apply this in your business?
Book a free 30-minute call (Vietnam time, in English or Vietnamese).