



What are funnels and cohorts?
A conversion funnel is a series of steps customers go through from the moment they know about you to the moment they pay, for example landing on your page, leaving their information, scheduling a call, making a purchase; each step counts how many people remain to see where customers drop off. A cohort is a group of customers that share a common starting point, usually the same month they first visited or the same month they made their first purchase, and then you track that group over the following months to see how many come back.
For small businesses, the funnel answers the question "where do customers leave", while the cohort answers the question "do old customers stay". This post does not promise that reading funnels and cohorts will increase revenue, and does not provide "industry standard" conversion rates because we have not verified any such numbers. All tables of numbers in this post are hypothetical. The post explains how to choose funnel steps, calculate drop-off rates, build a retention cohort table, how to read the table, which metrics to watch, and three common traps when you have little data.
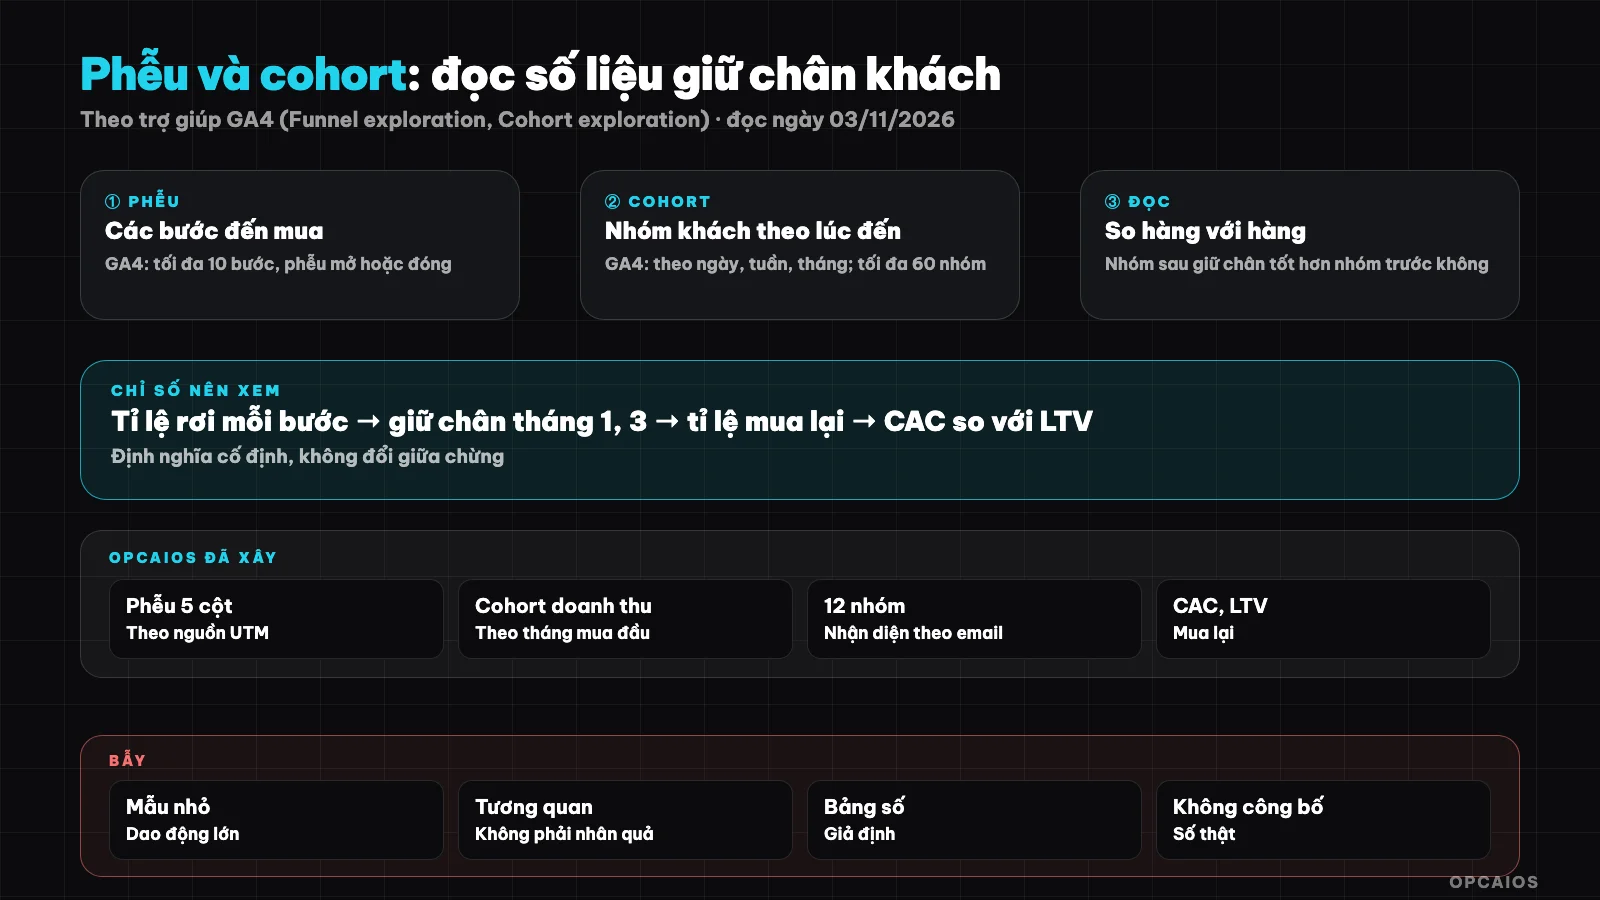
The funnel shows where customers leave; the cohort shows whether old customers come back. Diagram: OPCAIOS.
What steps does a conversion funnel include?
A conversion funnel includes steps that customers must or usually go through before buying, and each step must be measurable by a clear event. For small businesses selling services or courses, a four-step funnel is usually enough:
- Page views: someone viewing your landing page or product page.
- Customer leaves their information: submitting a form, signing up for materials, registering for an event.
- Scheduling a call or requesting a quote: booking a consultation call, asking for a price quote.
- Paid order: an order with paid status, not counting cancelled orders.
An important rule is that each step counts people, not visits. A person submitting a form three times is still one customer who left their information. If customers come from ads or posts, attach UTM parameters to separate the funnel by channel; see What is UTM and What is GA4.
How is drop-off rate calculated?
Drop-off rate is the percentage of people at one step who do not move on to the next step, calculated as one minus the conversion rate between two steps. Example scenario: 2,000 page views, 80 people leave their information, 20 people schedule calls, 6 people buy. The conversion rate from page view to leaving information is 80 divided by 2,000, which equals 4%, so the drop-off is 96%. From leaving information to scheduling is 25%, drop-off 75%. From scheduling to buying is 30%, drop-off 70%. The table below summarizes (hypothetical, not actual data):
| Step | Number of people | Conversion from previous step | Drop-off |
|---|---|---|---|
| Page views | 2,000 | ||
| Leave information | 80 | 4% | 96% |
| Schedule call | 20 | 25% | 75% |
| Paid order | 6 | 30% | 70% |
The first step always has the highest drop-off because most people just browse; the right question is which step drops off more than reasonable and what can be fixed. If you want to test changes on your page when traffic is low, see A/B testing a landing page with low traffic.
What is the difference between open and closed funnels?
A closed funnel only counts people entering from the first step, while an open funnel allows people to enter at any step. The Google Analytics help documentation on Funnel exploration (accessed 03/11/2026) describes both types correctly: in a closed funnel, a user who skips a step will not be counted in later steps; users are only counted when they complete steps in order. That page also notes that each funnel has a maximum of 10 steps, you can turn on average time between steps, filter by one dimension like device type, and see the top five actions after each step. For small businesses, referred customers often text asking for a quote without submitting a form first, so a closed funnel will miss them; look at both types so you don't overlook the group jumping straight to a middle step.
What is Cohort and Why Should I Group Customers by Month?
A cohort is a group of customers who share a common starting point, and a cohort table tracks each group through the periods after that starting point. Google Analytics documentation on Cohort exploration (read on 03/11/2026) calls the condition for entering a group the "inclusion criteria", which could be a first visit, any event, a transaction, or a conversion; the condition for returning is the "return criteria"; groups can be divided by day, week, or month, and weeks are counted from Sunday to Saturday. Small businesses should group by the month of first purchase for two reasons. First, the number of customers each week is too small, so grouping by week will result in mostly rows with one or two people. Second, the business question is usually "did customers who made their first purchase in May buy again", not "did people who visited the page this week come back to the page". Grouping by month of first purchase works better for free products or content, where repeat visits matter more than orders.
How Do I Read a Cohort Table to Understand Customer Retention?
You read a cohort retention table by rows to see one group over time, and by columns to see different groups at the same age. The table below is a hypothetical example, not real customers: each row is a month of first purchase, the "Month 0" column is the month of first purchase so it is always 100%, and the columns after are the percentage of customers in the group who made another purchase that month.
| First Purchase Month | Number of Customers | Month 0 | Month 1 | Month 2 | Month 3 |
|---|---|---|---|---|---|
| 05/2026 | 20 | 100% | 15% | 10% | 10% |
| 06/2026 | 25 | 100% | 20% | 12% | |
| 07/2026 | 18 | 100% | 22% | ||
| 08/2026 | 30 | 100% |
Reading it consists of four steps:
- Read by row: the 05/2026 group drops from 15% to 10% and then holds at 10%, meaning there is a small group of loyal customers.
- Read by column: in Month 1, the later groups gradually increase from 15% to 22%; if this trend continues, post-purchase care may be improving.
- Read diagonally: cells from the same calendar month lie on a diagonal; if the entire diagonal drops, the cause is usually a common event like a holiday, not the quality of the group.
- Read the customer count: with 18 customers, one additional purchase is already 5.5 percentage points, so small differences don't mean much.
Google Analytics has three ways to calculate cells: standard (only counts people who return in that specific period), rolling (counts people who return in that period and any earlier periods) and cumulative (running total). Specify which type your table uses, because the three types give three different pictures.
What Metrics Should a Small Business Track?
A small business should track few metrics but track them consistently, with each metric tied to a specific decision. The five metrics below are enough for most cases:
- Conversion rate at each funnel step by channel: decide which channel is worth continuing.
- Cost per new customer (CAC): advertising spend or channel cost divided by the number of first-time buyers in the period; only calculated when you have cost data.
- Repeat purchase rate: percentage of customers who have made two or more orders.
- Revenue by cohort: how much money each customer group brings in at the first month, months 1 to 3, 4 to 6, 7 to 12.
- Estimated lifetime value (LTV): total revenue of the group divided by the number of customers; compare with CAC to see if the channel is profitable.
To send these numbers automatically each week, see automatic weekly reports for OPC owners using n8n. To learn which channel gets credit for an order, see what is attribution.
What Are the Common Pitfalls That Lead to Misreading Funnels and Cohorts?
The three most common pitfalls are too small a sample, changing definitions midway, and confusing correlation with causation. Each pitfall has a specific way to avoid it:
- Small sample: a group of 20 customers where the return rate goes from 10% to 15% is just one more person. Write the number of customers next to every percentage, combine three months into one group if each month is too small, and only conclude when the trend repeats for a few periods.
- Changing definitions midway: this month "customers who left information" includes comments, next month it does not; or you change how you attach UTM tags. The funnel will jump without it being because of customers. Write the definition of each step on a page, note the date of any changes, and do not compare two periods with different definitions.
- Confusing correlation with causation: the customer group from July returns more often, and in July you started sending care emails, but July could also have a new product or shopping season. To know if emails work, you need a group that does not receive emails to compare, or at least try again in another period.
One more small pitfall: customer identification. If you identify customers by email, one person buying with two emails becomes two customers, and the repeat purchase rate is underestimated.
OPCAIOS's Experience
OPCAIOS has a Funnel and Cohort page in the Marketing administration area, written by a programming agent. The funnel on this page has five columns by channel (UTM source) and by campaign over a selectable period, defaulting to 90 days: page visits counted by unique people each day, people who left information counted by unique individuals (email or phone number) from forms, resource pages and event sign-ups, appointments, paid orders and new customers (people whose first paid order falls in the period). Orders are credited to the UTM at checkout time; if there is none, they are credited to the customer's first touchpoint in the internal CRM. When channel costs are recorded, the cost per new customer is calculated; lifetime value and repeat purchase rate are calculated across the full history from the first credited order. Cohort groups customers by their first purchase month, showing the 12 most recent groups, with revenue in the first month, months 1 to 3, 4 to 6, 7 to 12 and number of repeat customers; this is a revenue cohort, not a page return cohort. Customers are identified by email, so the two email traps mentioned above apply to us. OPCAIOS does not publish figures from this page, and we do not yet have enough customer groups to draw any conclusions about retention.
Frequently Asked Questions
Do small businesses need both funnel and cohort?
Small businesses need both if they are both finding new customers and want existing customers to buy again. The funnel helps fix landing pages, forms, and how you consult; cohort helps fix the product, after-sales care and repeat purchase programs. If you only sell once to each customer, like an all-in-one website building service, the funnel matters more; cohort then serves to track referrals or maintenance packages.
How many customers does a cohort table need to be meaningful?
There is no fixed number, but the smaller the group, the more each person makes the percentage jump sharply. With a group of 20 customers, one additional purchase is already 5 percentage points. The practical approach is to always write the number of customers next to the percentage, combine many months into one group when each month has only a few customers, and only trust a trend when it repeats across many consecutive groups. Before you have enough customers, read each returning customer as a specific story, ask them why they bought again.
Can you do funnel and cohort with Google Analytics?
Yes. Google Analytics 4 has two exploration templates called Funnel exploration and Cohort exploration; according to Google Help documentation (read 03/11/2026), cohort displays a maximum of 60 groups. The limitation is that Analytics only sees behavior on the page; payments made by bank transfer or customers closing via phone need to be recorded additionally from CRM or spreadsheet, see What is CRM. Combine the two sources by email or order ID so the funnel has the final step too.
What is a good retention rate?
This post does not provide a standard level because we have not verified any comparable data we trust for small businesses in Vietnam, and the rate depends very much on the type of product. A course sold once naturally has a lower repeat purchase rate than a monthly subscription service. A more useful measure is comparing to yourself: does the next customer group have better retention than the previous group, and does that change coincide with something you did. Set goals based on your own trend rather than a number you heard somewhere.
Where should I start measuring if I don't have any tools yet?
Start with a spreadsheet with three things: a list of paid orders with date and customer email, a list of people who left information with source, and a page defining each funnel step. From the order list, filter the first purchase month of each email and you instantly have a cohort table; from the people list, count by source and you have a funnel by channel. Add UTM to every ad link and post from today so your data is cleaner later. To learn how to build spreadsheets, CRM and automated reports using AI, see OPCAIOS's AI application training course.
Source: Google Analytics Help, pages "[GA4] Funnel exploration" and "[GA4] Cohort exploration" (read 03/11/2026); all tables and examples in this post are assumed; no retention rate or "industry standard" conversion rate has been verified so none are stated; the effectiveness of reading funnel and cohort has not been measured by OPCAIOS. The experience is OPCAIOS's.
Translated from Vietnamese with AI. Read the original.
Want to apply this in your business?
Book a free 30-minute call (Vietnam time, in English or Vietnamese).