


Status page for small websites
A system status page is a website that tells customers which main parts of your service are running normally, running slowly, or are down, along with notifications when problems occur and when they're fixed. For a small one-person website, a status page is useful if your customers depend on you to log in, learn, pay, or book appointments. This post doesn't promise that a status page will make your website more stable: the page only reports status, while keeping the website running is the job of monitoring and deployment. This post covers: what large public status pages display, what to measure (availability, latency, errors), why to check from outside, alert thresholds, honest incident notifications, what shouldn't be public, and the status page OPCAIOS is using along with unresolved limitations.
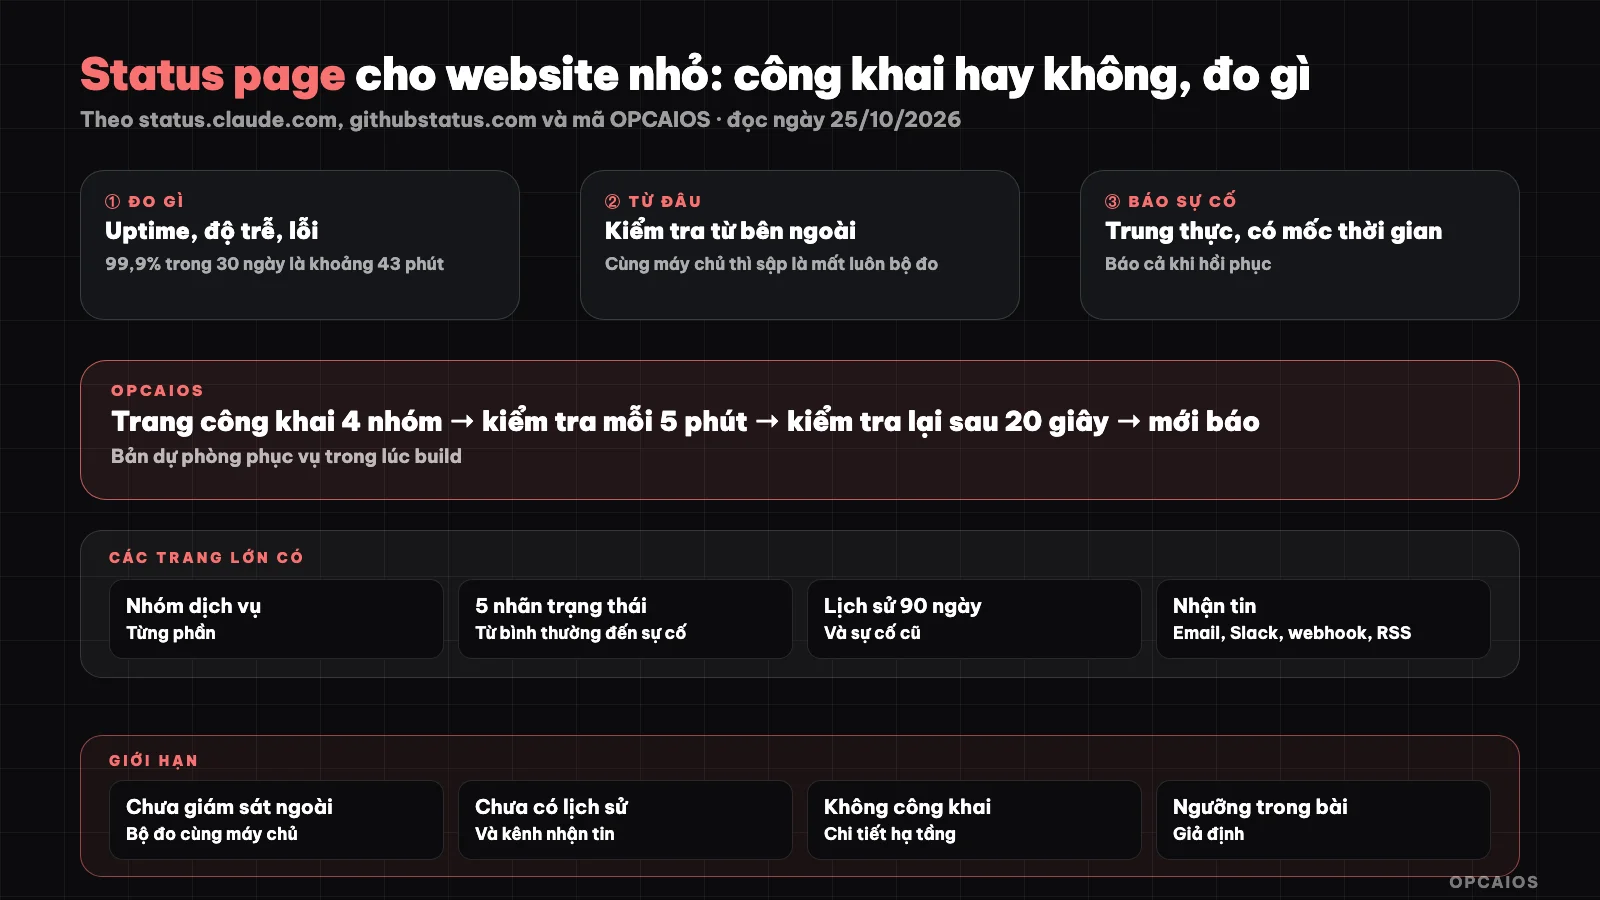
Measure from outside, alert yourself, make public to customers at the right level. Diagram: OPCAIOS.
What is a status page and does a small website need one?
A status page is a public page that answers one question from your customers: "Is the error because of me or because of your service?". When a customer can't log in, a status page showing "login is down, being handled" helps them not send you a message asking, not try again and again, and trust that you already know. A small website should have a status page if it meets at least one of these conditions:
- Customers have already paid and use the service regularly: courses, memberships, software.
- There are time-sensitive workflows: payments, booking appointments, login codes sent by email.
- You work alone and can't reply to each person when something goes wrong.
If your website only has blog posts and an about page, a message on social media when something goes wrong is usually enough, and you should focus effort on monitoring for yourself.
What do large public status pages display?
Large public status pages all divide the service into groups that customers understand, tag each group with a status label, and keep incident history. Reading on 25/10/2026: status.claude.com lists groups like claude.ai, Claude Console, Claude API, Claude Code; githubstatus.com lists Git Operations, Webhooks, API Requests, Issues, Pull Requests, Actions, Pages, Codespaces and other groups. Common points I read on both pages:
- Five status labels: Operational, Degraded Performance, Partial Outage, Major Outage, Maintenance.
- A 90-day history bar for each group, with days without incidents clearly marked as no disruption.
- Incident history by day, each incident has update steps; on status.claude.com that day there was one incident in the "Monitoring" step.
- Channels to subscribe for updates: email, SMS, Slack, webhook, RSS or Atom.
Both pages don't display servers, data regions or internal architecture; customers only see the name of features they use.
What should I measure on a small website?
A small website should measure three things: availability (does the page respond), latency (does it respond quickly or slowly) and errors (does it respond correctly or break in the browser). Each needs a specific definition before measuring.
| Metric | How to measure | Example threshold (assumed, adjust yourself) |
|---|---|---|
| Availability | Call the homepage and login page regularly, count success codes as "up" | Two consecutive errors is "down" |
| Latency | Time from request to receiving response | More than a few seconds is "slow" |
| Server errors | Ratio of requests returning errors | Sudden spike from normal day |
| Browser errors | JavaScript errors that the customer's browser reports | New error type appearing |
| Main workflow | Payment, email, database responding | One workflow stopped is "partial outage" |
Don't measure too much: each metric must have someone (usually you) who knows what to do when it turns red.
Why Check from the Outside?
Checking from the outside means a system located elsewhere calls into your website like a real visitor, through the correct domain name and public network. A test runner on the website's own server has a major blind spot: when the server goes down, the test runner also goes down and nobody gets notified. Internal checking still has value for measuring databases, disks, or backups, but the question "can the customer get in" needs an independent viewpoint. For small websites, you can use an outside monitoring service with a free plan, or another machine of yours running periodic check commands; we have not compared and verified prices for these services so we won't name them or give figures. What to check when choosing: check frequency, number of check points, alert channels, and whether the service needs you to open extra access rights to your server.
How to Set Alert Thresholds to Avoid False Alarms?
A good alert threshold is one that makes you take action every time you get a message, not one that makes you turn off notifications after a week. Three practical rules:
- Check again before alerting: one failure might just be a flaky network; wait a few dozen seconds and try again, alert only on the second failure.
- Alert once when broken, once when recovered: the recovery message should record the downtime length, so later you have real data about the incident.
- Separate "slow" from "broken": slow is a yellow alert to look at later, broken is a red alert needing immediate action.
Send alerts through a channel you actually read, like a Telegram bot or webhook into your automation flow, and set a backup channel if the main channel depends on the website itself.
How to Write an Honest Incident Notification?
An honest incident notification tells what you know, what you don't know yet, and when you'll update next. A four-step template, similar to how large status pages split updates:
- Investigating: "Some people cannot log in since 9:10. We are checking, update in 30 minutes."
- Identified: state the affected part and what customers should do temporarily.
- Monitoring: fixed, watching for recurrence.
- Resolved: downtime length, impact, and what you did to prevent it happening again.
Don't write "everything is normal" when unsure, don't blame a generic "provider," don't delete old incidents from history. If customer data was affected, state the scope clearly and refer to legal obligations (not legal advice).
What Should Not Be Public on the Status Page?
The status page should not publish any detail that helps outsiders attack the system: server addresses, ports, software versions, internal service names, network structure, raw error messages, or private infrastructure provider names. Customers only need the feature name they use and its status. Keep technical details on the admin page behind login. See more at 5 data security rules for business data when using AI.
OPCAIOS Experience
OPCAIOS has a public /status page and a "System Health" page in the admin area. At a conceptual level:
- The public page has only four groups: website, login and courses, bank transfer payments, email. Each group only shows "operating", "interrupted" or "not open", with no configuration details. The page rechecks itself at most once per minute and logs the check time.
- The internal page measures more: website response time over the public route, database, backup status, disk space, memory, browser JavaScript errors reported by users in the last 24 hours, and real loading speed for viewers.
- Alerts every 5 minutes: website, course page and database are checked; errors are rechecked after about 20 seconds before reporting; one message when broken, one message when running again with the number of minutes interrupted; responses slower than 2.5 seconds are marked "slow" on the internal page.
- Deployment with no downtime: when building a new version, a backup copy of the website continues serving customers; if the build fails, the running version stays the same. According to project notes, during one measurement while deploying everything, over 1,200 requests came in and all were answered successfully.
Limits we know about: the checker runs on the website's own server, so when the entire server stops there is no alert; we have not yet used independent monitoring from outside. The "Website" line on the public page is always green when the page loads, so it does not reflect when the website is completely down. The public page does not yet have 90-day history, incident history or alert channels. This is what should be done next, and is part of the plan to unplug when AI tools get more expensive or break down: knowing early what breaks helps you switch to a backup plan in time. See also 10 lessons from having an AI agent build and run a website.
Frequently Asked Questions
Should a small website make its status page public?
Yes, if customers have already paid and depend on the website to log in, learn, pay or book time. A status page reduces messages asking about issues and shows you know about them. If the website only has blog posts, making the status page public has little value; you should focus on monitoring and alerts for yourself first. Whether public or not, the page should only show feature names and status, not infrastructure details.
How often should a status page check?
For a small website, checking every few minutes is usually enough to know about issues before many customers run into them. Checking more often creates more load and more false alerts without helping you fix things faster when you are working alone. More important than frequency is rechecking before alerting, so a brief network glitch does not wake you at midnight, and checking from somewhere outside the website's own server.
What does 99.9% uptime mean for a small website?
Uptime is the ratio of time the website answers requests in a time period. Roughly, 99.9% in 30 days equals about 43 minutes of downtime. For a small website, do not promise an uptime number if you have not measured it using independent monitoring over many months. Measure first, publish real history later, and if you make a promise to customers then be clear about how it is calculated, how you will refund, and what cases are excluded.
Should I build a status page myself or use a ready-made service?
Building it yourself works when you want the page to show your exact feature groups and already have check data in place. A ready-made service works when you need incident history, alert sign-up channels and outside check points without wanting to build them yourself. One thing to note: a status page built on the same server will go down with the website, so the checking and alert part should have a separate route outside that server.
Where do I start if I have nothing yet?
List three to five features your customers use most, set up a periodic check from outside for your homepage and login page, send alerts to a channel you read every day, then prepare a four-step incident notification template. Once you have a few weeks of data, then make the public page. If you want to learn how to use AI and automation tools to monitor, alert and run a website alone, see OPCAIOS's AI application training course.
Source: status.claude.com and githubstatus.com (only the parts, status labels, 90-day history and alert channels shown on the page), accessed 25/10/2026. Have not verified names, prices or features of outside monitoring services; thresholds in the table are assumed examples. Experience is from OPCAIOS.
Translated from Vietnamese with AI. Read the original.
Want to apply this in your business?
Book a free 30-minute call (Vietnam time, in English or Vietnamese).